How to Use Support and Resistance in Forex Trading
Support and resistance are often mentioned early, but they are not always understood in a practical way.
At a basic level, they represent areas where price has reacted before. These are points on the chart where movement has slowed down, reversed, or struggled to continue. Because of this, they naturally draw attention.
But they are not exact signals.
They do not predict what will happen next. Instead, they provide context. And in Forex trading, context often makes the difference between reacting randomly and making more considered decisions.
Think in terms of areas, not exact lines
One of the first adjustments that tends to help is changing how these levels are viewed. Support and resistance are rarely precise.
It can be tempting to draw a single line and expect price to react exactly at that point. In reality, price often moves slightly beyond or falls short before reacting. This is why it is more useful to think in terms of zones rather than exact levels.
These zones represent areas of interest.
When price enters them, something tends to happen. It may slow down, pause, or change direction. Not always, but often enough to be worth noticing.
In Forex trading, this approach reduces unnecessary precision. It allows more flexibility in interpretation and helps avoid the frustration of expecting exact reactions.
Pay attention to behaviour, not just location
The level itself is only part of the picture. What often matters more is how price behaves when it reaches that area.
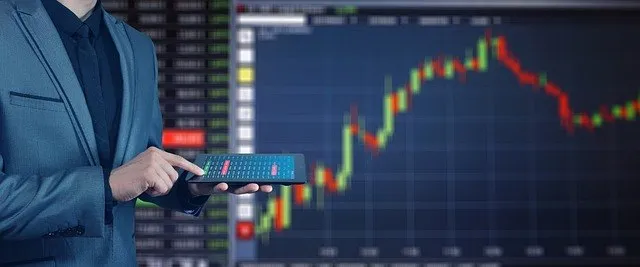
Image Source: Pixabay
Sometimes price approaches slowly, with smaller movements, suggesting hesitation. Other times it moves quickly through the level, showing strong momentum. In some cases, it touches the area and reverses almost immediately.
Each of these reactions provides different information.
For traders in Brazil, observing this behaviour over time can make support and resistance more meaningful. It becomes less about drawing lines and more about understanding how the market responds in certain areas.
With Forex trading, this shift from static levels to dynamic behaviour often leads to clearer decision-making.
Notice how the same level can act differently
A level that once acted as support can later act as resistance, and vice versa.
This happens when price moves through an area and then returns to it from the opposite direction. What was previously holding price up may begin to hold it down.
At first, this can seem inconsistent. But over time, it becomes easier to recognise. These repeated interactions with the same level often carry more significance than isolated reactions.
In Forex trading, watching how price revisits these areas can add depth to analysis, especially when combined with other observations.
Combine levels with basic structure
Support and resistance do not work in isolation. They tend to be more useful when viewed alongside basic market structure. For example, in a trending market, price may react differently at these levels compared to a sideways market.
In an upward trend, support levels may hold more consistently. In a downward trend, resistance may become more relevant.
This does not guarantee outcomes. But it provides context.
For traders in Brazil, combining these simple ideas often makes analysis feel more connected rather than fragmented. Forex trading becomes less about isolated tools and more about how different elements work together.
Avoid adding too many levels
It is easy to overcrowd a chart.
At first, drawing multiple lines may feel helpful. It creates the impression of detailed analysis. But too many levels often make it harder to see what actually matters.
Not every reaction needs to be marked. Focusing on the most visible and repeatedly tested areas tends to be more effective. These are the levels that stand out clearly, without needing to search for them.
In Forex trading, clarity often comes from removing unnecessary detail rather than adding more.
Give the levels time to make sense
Understanding support and resistance does not happen immediately. At the beginning, they may seem inconsistent or unclear. But with repeated observation, patterns begin to emerge.
Certain levels hold more often. Others break more easily. Some reactions are stronger, while others are brief.
This understanding develops gradually.
For traders in Brazil, taking time to observe rather than rushing to apply these concepts often leads to a more stable approach. It becomes less about drawing levels correctly and more about recognising how price behaves around them.
And in Forex trading, that shift in perspective often makes these tools more useful over time.

Comments